RELATIONSHIP BETWEEN SERVICES
In the world of microservices, one of the issues is the interdependence between many services. More complex services are not atomic but consist of a cross-call graph.
The use of tools and mechanisms to monitor, diagnose and analyze such dependencies and the mutual influence of services on operational efficiency is an important aspect of the microservice environment.
WHAT IS JAEGER
Jaeger is an open-source tool for the so-called distributed-tracing, i.e. tracking the mutual dependence of calls between distributed services. It allows you to monitor and investigate problems and issues related to it in the microservice environment, such as:
- propagation of the context between the service invocation graph
- monitoring of distributed transactions
- locating the source of the error in the call sequence
- analysis of dependencies between services
- service performance analysis
HOW JAEGER WORKS
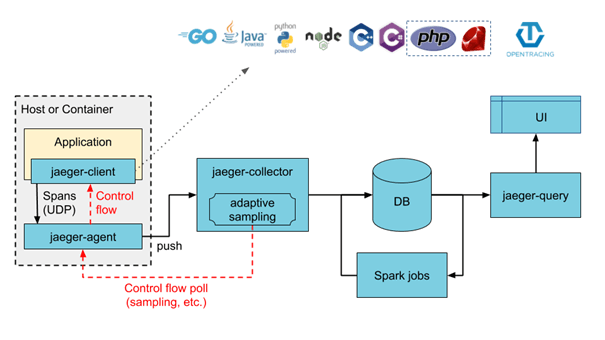
To be able to transfer information about processing to Jaeger, the tracked microservice must be documented with the jaeger-client code, which will enable reporting data to be sent to the jaeger-agent running on the same host on which the microservice is running.
Jaeger supports code instrumentation in Go, Java, NodeJS, Python, C ++ and C #.
Then the jaeger-agent sends the data to the jaeger-collector via the streaming mechanism (it can be another host). Collector receives the call trace data, validates it, and processes and indexes it appropriately so that the call details and dependencies data can be searched by the jaeger-query module. This data can be stored persistently or stored in memory. Jaeger uses Kafka to send information from agents to the controller, while Elasticsearch is used to analyze the search for trace data. Data can also be written by Jaeger to the Cassandra database.
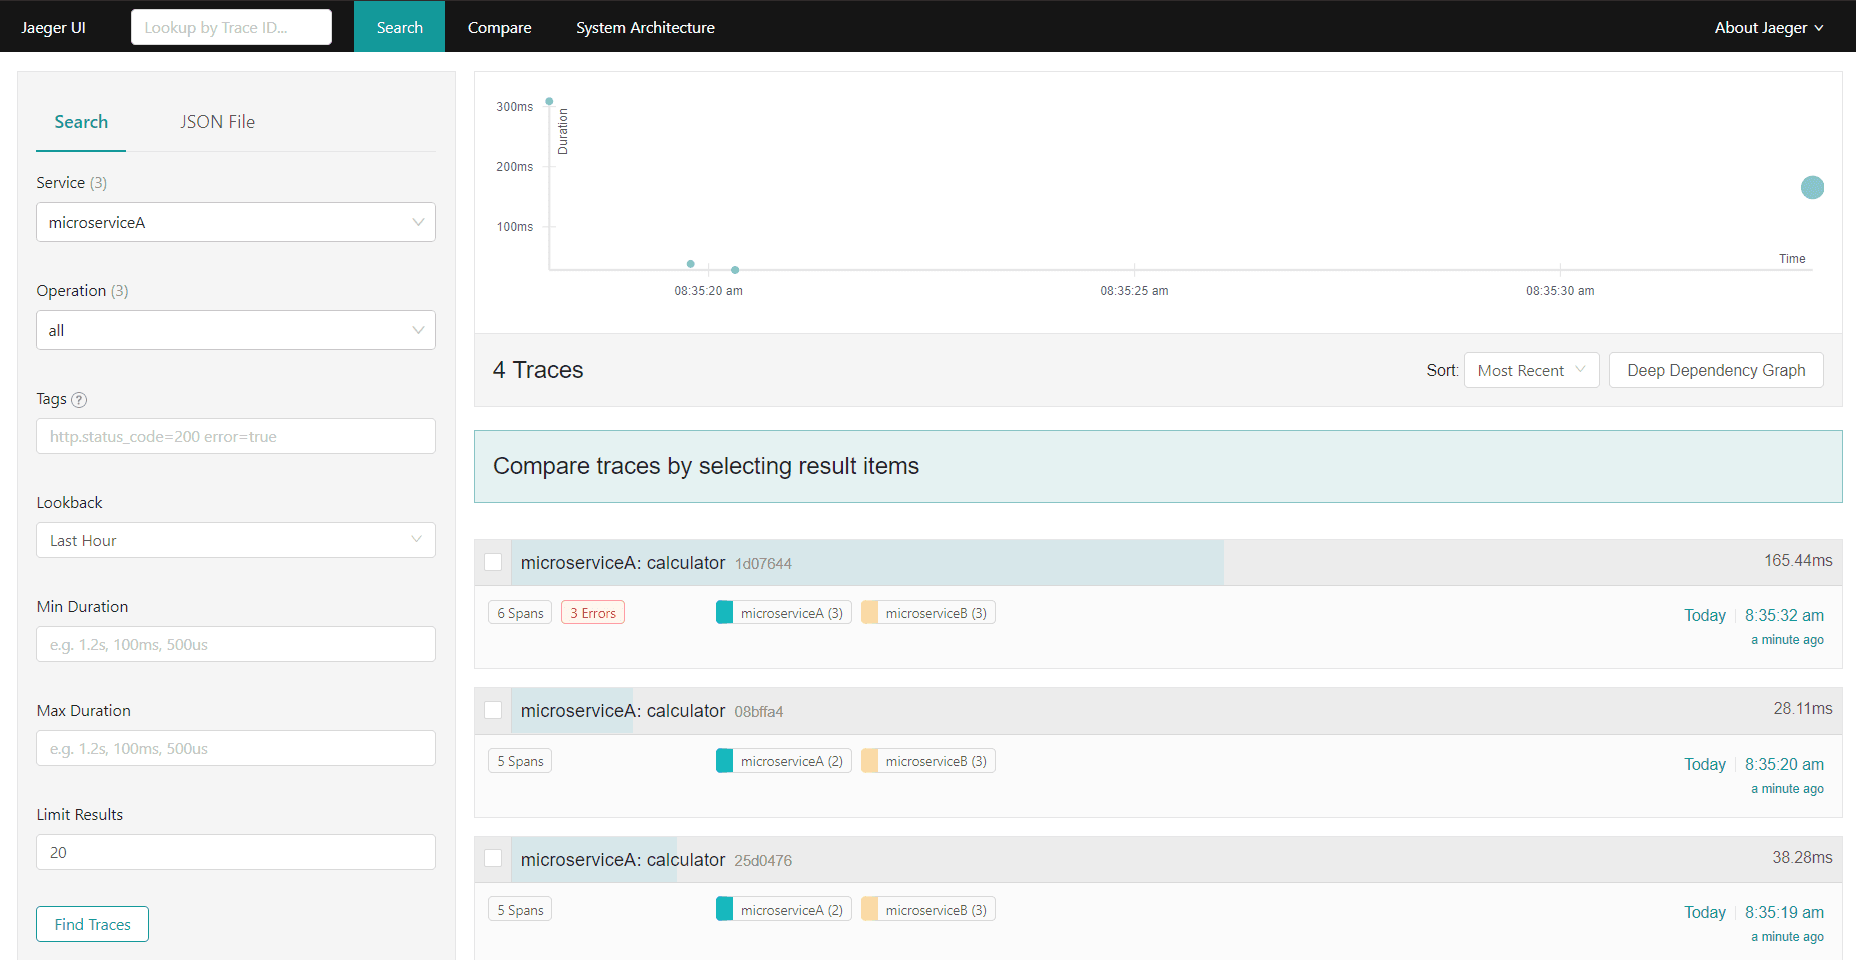
For visual analysis, the user is provided with the Jaeger console that presents in a graphical form all information about dependencies and processing details. It provides, among others a search engine with which we can search for a base from "trace" by providing names of services, tags, parameters, time limits.
After finding the course of "trace" we are interested in, we can display its details of the service call graph with mutual dependencies and details, including processing time.
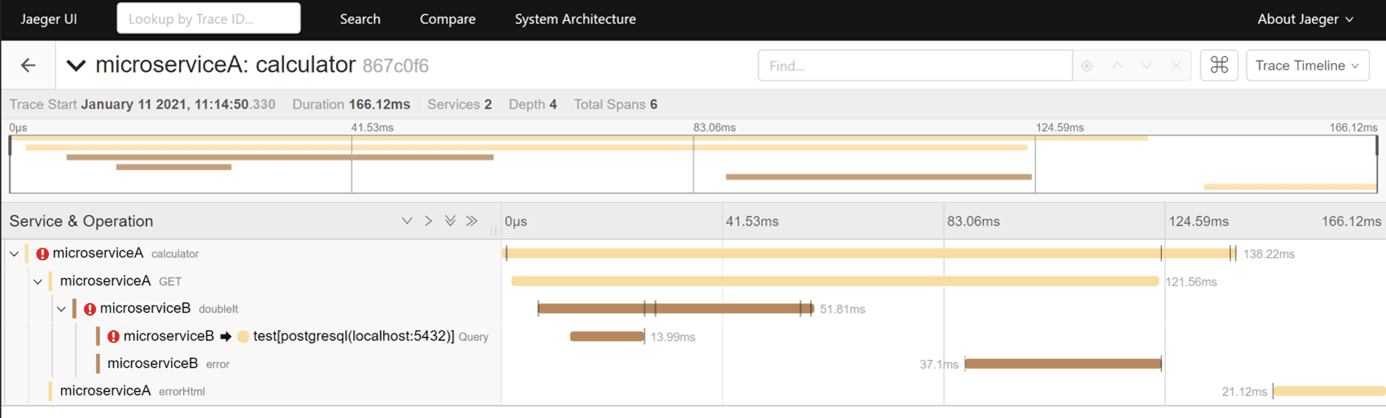
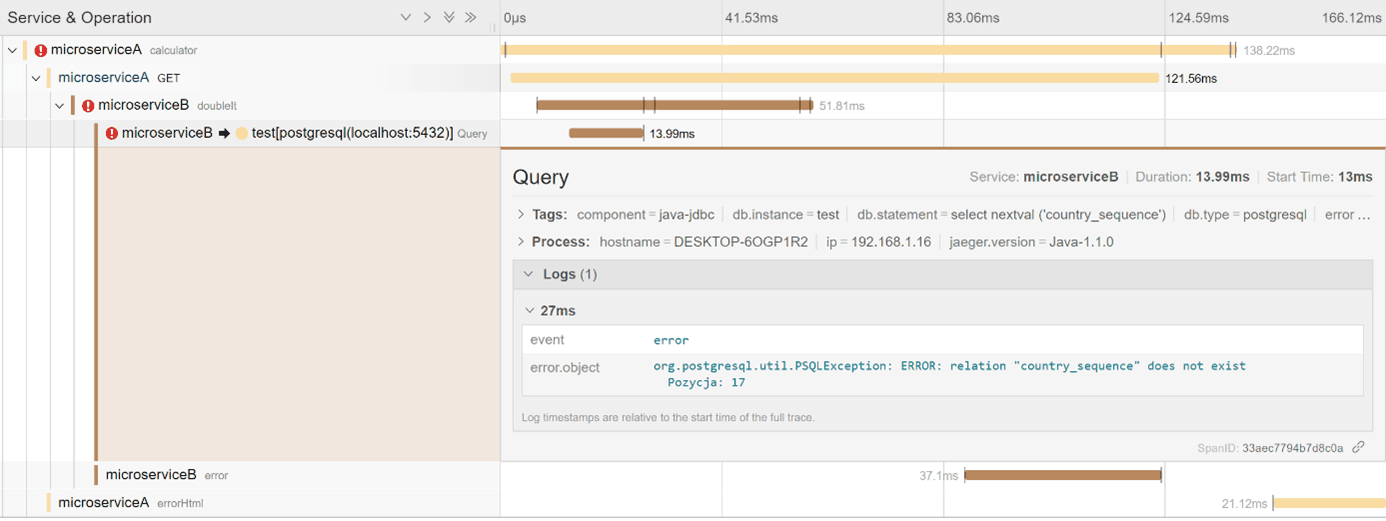
Errors and exceptions are also shown on the console.
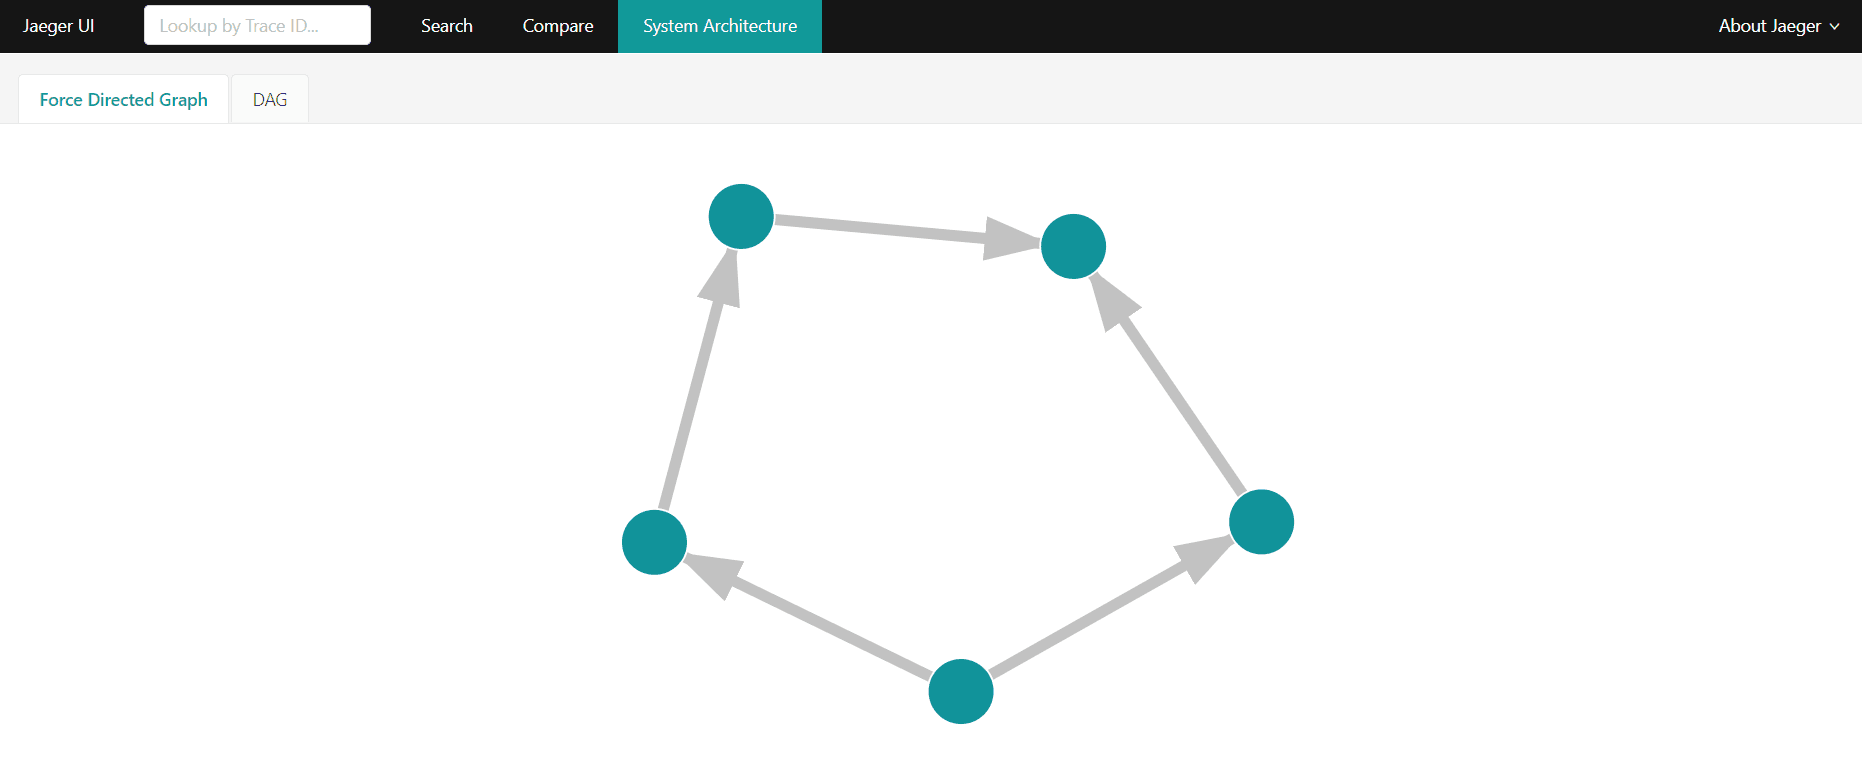
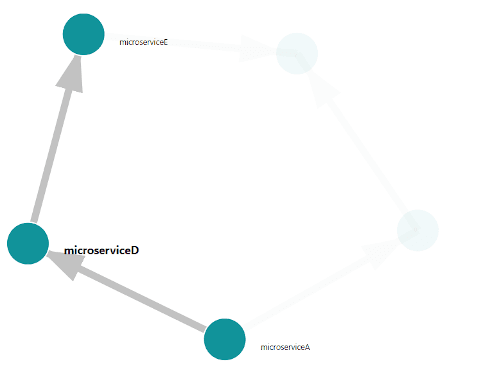
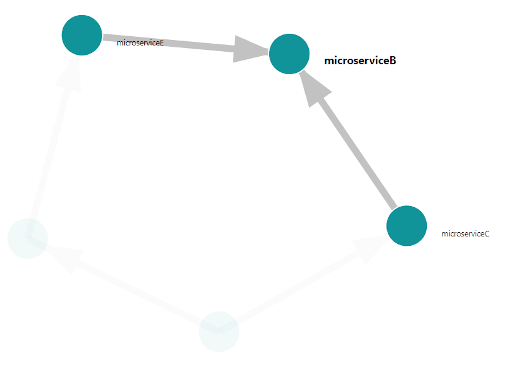
The console also provides a mechanism for visualizing the system architecture identified based on call graphs (System Architecture tab). It is presented in the form of a directed graph where nodes are services and arcs are directions of dependence (which microservice uses which services).
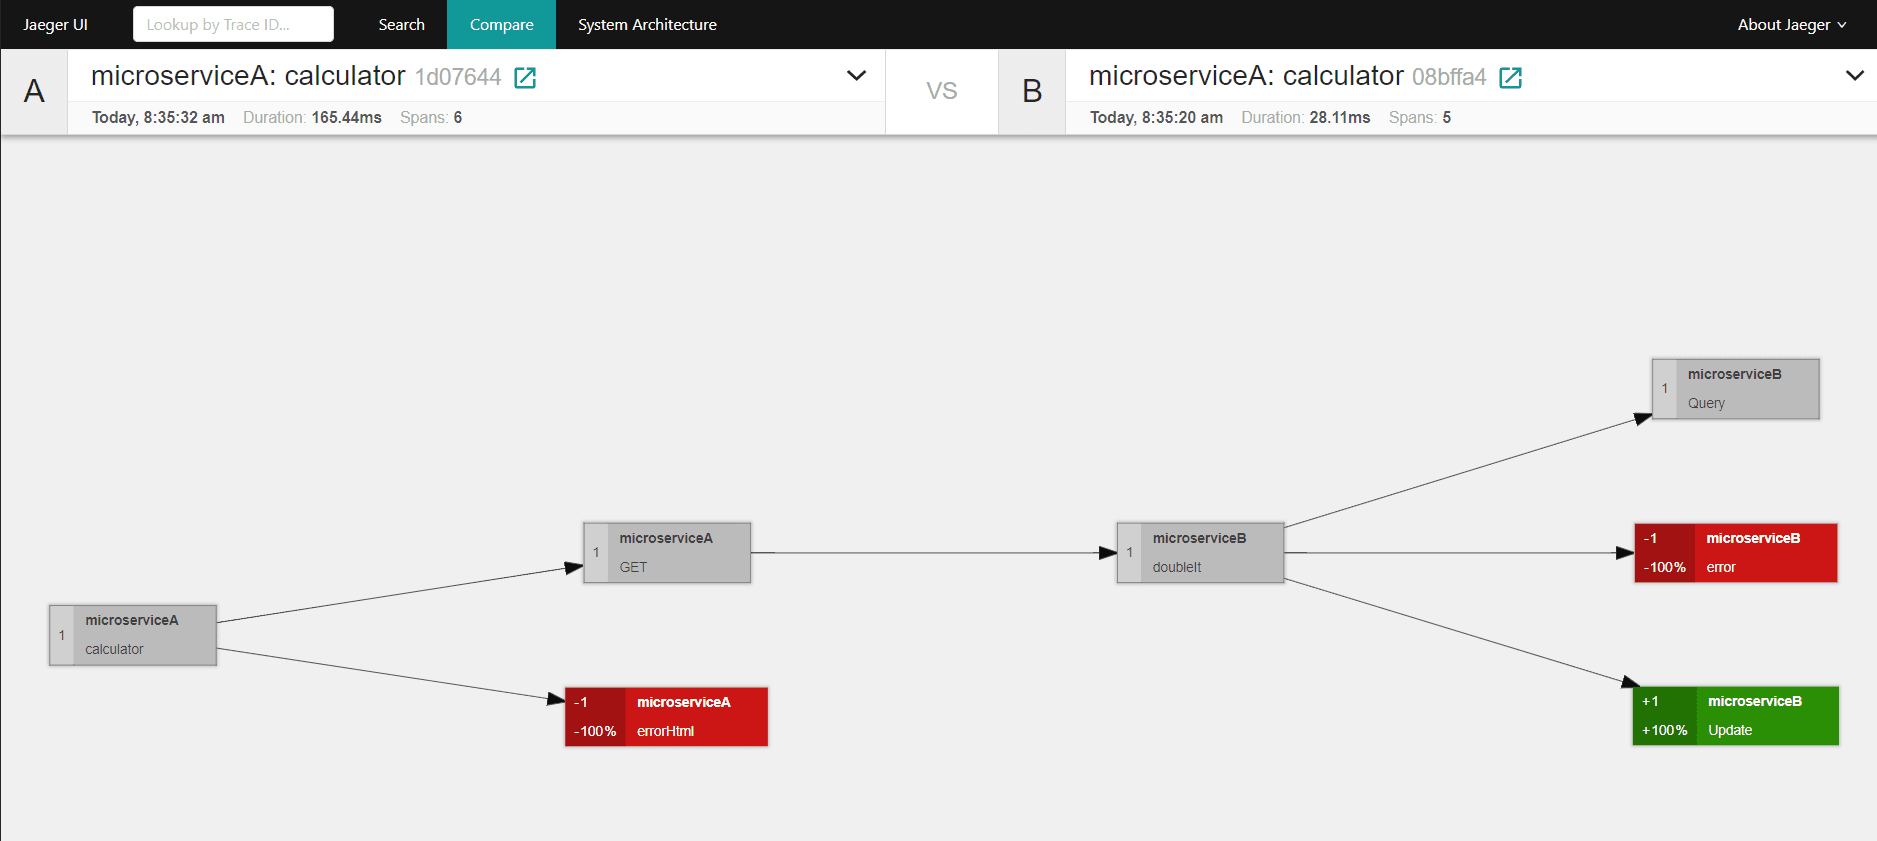
We also have a tool for comparing two calls in the console. The resulting diagram shows us what elements of the call overlap (grey), which have been removed from the reference processing (red), and which have been added (green).
The quickest way to use Jaeger is to use the available pre-configured docker image to run all Jaeger modules within a single container. All modules are then run under one host.
This configuration allows us to test Jaeger or use it to quickly configure the environment for incidental analysis.
JAEGER ON A KUBERNETES CLUSTER
Jaeger has a prepared configuration of objects for deployment on a Kubernetes cluster based on the Kubernetes Operator pattern. Its implementation in a cluster enables generic instrumentation of microservices.
After installing the Agent on the cluster, it will search, monitor and instrument pods with sidecar.jaegertracing.io/inject annotation in Deployment informing that the indicated pod should be instrumented by the Agent with a sidecar container from jaeger-agent to send trace information.
We decide which of the namespace jaeger-agent will be monitored by parameterizing the K8S RoleBinding object that grants the Service-Account permissions for the jaeger-operator. By default, this is only the space where the Agent will be deployed.
The last step is to deploy Jaeger components on the cluster by using the Jaeger CRD (Custom Resource Definition) object. The default configuration is called the "allInOne" strategy - that is, running the agent, collector, ingester and console on one pod. It should be mentioned that on production clusters, the configuration of the deployment of these components is a bit more complex. In such cases, the "production" or "streaming" strategies should be used, enabling more complex implementation configurations necessary in production environments, including:
- the ability to select and define service configuration parameters for the persistent recording (Kafka, Elasticsearch, Casandra)
- the possibility of using external Kafka or Elasticearch clusters
- the ability to manage the auto scalability and replicability of the collector
SUMMARY
Jaeger is a valuable open-source tool to support the analysis and monitoring of microservices on a Kubernetes cluster, which turns out to be very useful both for teams maintaining the cluster to identify the source of the error and for development teams to identify "bottlenecks" and optimize the performance of key services.